Diabetes in Australia Statistics

Health Statistics
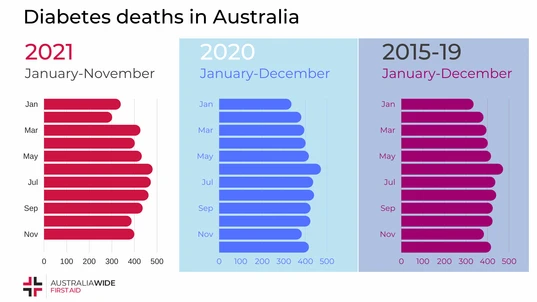
Australia recorded 4,535 deaths from diabetes between January and November 2021 – 10.4% higher than were averaged from 2015 to 2019.
Australia recorded 4,535 deaths from diabetes between January and November 2021. While statistics are still being gathered for 2021, this figure is comparable to the 4,515 deaths at the same point in 2020 but 10.4% higher than the 2015-19 average. In 2018, there were 16,700 deaths in Australia with diabetes noted as an underlying or associated cause. Putting it in perspective, this amounts to 10.5% of all deaths in Australia. Death certificates will often show the cause of death, not as diabetes itself, but as one of its complications. In cases where diabetes was associated, the most commonly listed underlying causes of death were cancer, coronary heart disease, and stroke. The types diabetes listed as underlying and/or associated cause of death in 2018 were as follows:- 5% (800 deaths) due to type 1 diabetes
- 56% (9,500 deaths) due to type 2 diabetes
- 39% (6,400 deaths) due to other or unspecified diabetes
- 56% (9,500 deaths) due to type 2 diabetes
Every case of diabetes is serious and while there may be no known cure, steps can be taken to manage the disease and stay healthy. In 2015, 4.7% of the total burden of disease in Australia was attributed to high blood plasma glucose levels (which includes diabetes and pre-diabetes). Diabetes cost an estimated 2.3% ($2.7 billion) of total disease expenditure in the Australian health system in 2015–16. Type 2 diabetes was the 12th largest contributor, accounting for 2.2% of Australia’s disease burden. Type 1 diabetes contributed 0.3% in the Australian Burden of Disease Study 2015.
What is Diabetes?
Diabetes is a disease marked by excessive levels of blood glucose – also known as blood sugar. Glucose from the food we eat gets into our cells with the help of insulin, a hormone made by the pancreas. Blood glucose then is our principal energy source. When the body becomes insulin-inefficient, glucose will fail to reach the cells and stay in the blood. Excess glucose in the blood, over time, can lead to health problems.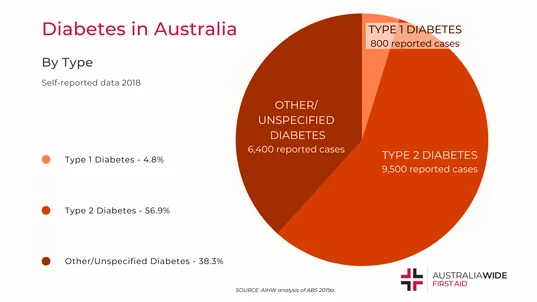
Type 1 and Type 2 diabetes are the most common forms, in addition to Gestational diabetes among pregnant women. On death certificates, diabetes also falls into unknown or undiagnosed categories.
Types of diabetes
Type 1 and type 2 are the most notorious forms of diabetes. Gestational diabetes is not uncommon. Diabetes can also fall into an unknown or undiagnosed category at the time of death.Type 1 diabetes
Type 1 diabetes is a lifelong autoimmune disease. Its onset is usually in childhood or early adolescence and its cause is unknown. Genetic and environmental factors are thought to be responsible. Except in cases of pancreatic transplant, type 1 diabetics need daily insulin replacement to survive. In Australia, 2,800 new cases of type 1 diabetes were recorded in 2018 by the National (insulin-treated) Diabetes Register – 12 cases per 100,000 population. Around 47,800 new cases of type 1 diabetes were diagnosed between 2000 and 2018 – an average of 7 new cases per day. During this period, the incidence rate on average for 0–14 year olds, was 1.4 times higher than for those aged 15–24, and 3.6 times higher than for those aged 25 and over. In 2017–18, around 63,700 hospitalisations were recorded with type 1 diabetes as the principal and/or additional diagnosis, 15,700 as the principal diagnosis and 48,000 as an additional diagnosis. Hospitalisation rates with type 1 as the principal diagnosis were highest among people aged 10 to 19 years – 96 and 118 per 100,000 for males and females, respectively. Hospitalisation rates were similar among males and females overall – 63 and 67 per 100,000 population, respectively.Type 2 diabetes
Type 2 diabetes is the most common form of the disease and is typified by insulin being either under-produced and/or not being used effectively. Type 2 with a later onset generally than Type 1, and is largely preventable. It has a genetic component but is often linked to lifestyle factors such as physical inactivity, poor diet, obesity, and smoking. Type 2 diabetes can be managed with changes to diet, exercise, insulin injections, glucose-lowering medications, or a combination of these methods. Close to 1 million Australian adults – 5.3% of over-18-yr-olds – had type 2 diabetes in 2017–18, according to self-reported data from the ABS 2017–18 National Health Survey. Incidence of Type 2 diabetes in adults:- 6.1% men and 4.6% women
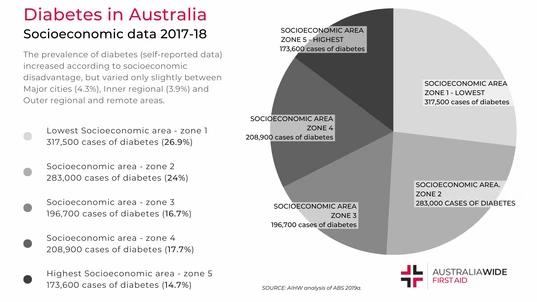
- Rates in the lowest socioeconomic areas (7.0%) were around twice those in the highest socioeconomic areas (3.3%)
In 2017–18, around 1.1 million hospitalisations were linked to type 2 diabetes – as the principal diagnosis in 35,000 cases, and as an additional diagnosis in 1,032,000 cases. These type 2 diabetes hospitalisations increased with remoteness and socioeconomic disadvantage.
- 2.5 times higher in Remote and very remote areas compared to Major cities
- 3.5 times higher in remote areas for females – 10,300 remote and 2,900 city per 100,000 population
- 1.8 higher in remote areas for males – 7,600 and 4,200 per 100,000 population
- Twice as high in the lowest socioeconomic areas compared with the highest socioeconomic areas
Gestational diabetes
Gestational diabetes is characterised by glucose intolerance of varying severity and is noticed, mostly in the 2nd or 3rd trimester, during pregnancy. It usually resolves after the baby is born but can recur in later pregnancies and significantly increases the chances of developing type 2 diabetes, in both the mother and the baby. In some cases, medication is given but often, gestational diabetes is managed with changes to diet and exercise. Around 1 in 6 females between the ages of 15 and 49 who gave birth in hospital in 2017–18, were diagnosed with gestational diabetes – 16.1% or 43,100 women – according to the National Hospital Morbidity Database. The incidence of gestational diabetes increased with age, peaking at 31% for females aged 45–49. Compared with non-diabetic mothers in pregnancy, mothers with pre-existing diabetes &ndash: either type 1, type 2, or gestational diabetes – had higher rates of caesarean section, induced labour, gestational hypertension, and pre-eclampsia c in pregnancy (based on data from the National Perinatal Data Collection for 2014–2015). Babies of mothers with pre-existing diabetes had more problems than babies of mothers with gestational diabetes or no diabetes. These problems included pre-term birth, stillbirth, low and high birth-weight, low Apgar score, resuscitation, and special care nursery/neonatal intensive care unit admission, and stayed longer in hospital.Other types of diabetes
Other types of diabetes include certain conditions or syndromes that result in defects in insulin secretion, insulin action, or both. These are relatively uncommon and glycaemic control is managed mostly through diet and exercise or use of other medications. Some cases may need insulin to manage blood glucose.How many Australians have diabetes?
An estimated 1.2 million Australians had diabetes in 2017–18, based on self-reported data in the Australian Bureau of Statistics National Health Survey. This statistic represents almost 5% of Australia's population and includes type 1 diabetes, type 2 diabetes, type unknown, but excludes gestational diabetes. Type 2 diabetes affected 998,100 people, while Type 1 diabetes affected 144,800 people. In 2017–18, around 1 in 6 women aged 15–49 who gave birth in hospital, were diagnosed with gestational diabetes (16.1% or 43,100 women – according to the National Hospital Morbidity Database. When it comes to the question of how many Australians have diabetes, the true numbers are likely underestimated because self-reported data does not include undiagnosed diabetes. The ABS 2011–12 Australian Health Survey, however, includes measured, as well as self-reported data. It showed one undiagnosed case for every 4 adults diagnosed with diabetes.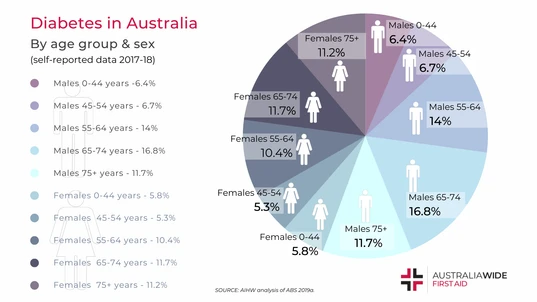
Diabetes occurred more often in males (5.0%) than in females (3.8%) according to 2017-18 data
Age and sex and diabetes
Diabetes occurred more often in males (5.0%) than in females (3.8%) according to 2017–18's self-reported data. Rates of diabetes increase steadily with age:- 45–54 years of age: 5% of males and 4% of females
- 55–64 years of age: 12% of males and 9% of females
- 65–74 years of age: 19% of males and 12% of females
- 75 years-and-over: 21% of males and 17% of females
Hospitalisation and deaths double from the highest to the lowest socioeconomic areas.
Socioeconomics and diabetes
Hospitalisation and deaths double from the highest to the lowest socioeconomic areas, although the prevalence of diabetes varies only slightly from cities to more remote areas. The rate of type 2 diabetes, being hospitalised, and dying is 4 times higher for Indigenous Australians than for non-Indigenous Australians.Hospitalisation due to diabetes
In Australia in 2017–18, 11% of all hospitalisations were linked to diabetes. These 2017–18 statistics show:- 53,900 hospitalisations with diabetes as principal diagnosis – 29% due to type 1 diabetes, 64% due to type 2 diabetes, 5% due to gestational diabetes, 1% due to diabetes ‘other or unspecified’.
- 1,149,000 hospitalisations with diabetes as additional diagnosis – 4% due to type 1 diabetes, 90% due to type 2 diabetes, 5% due to gestational diabetes, 1% due to diabetes ‘other or unspecified’.

In 2020, 30,800 Australians began using insulin to treat their diabetes.
Insulin for diabetes
In 2020, 30,800 Australians began using insulin to treat their diabetes – 16,000 of them for type 2 diabetes. In 2017–18, 1 in 20 Australians were estimated to have diabetes – 4.9% or 1.2 million of the population (based on self-reported data, ABS 2019). Insulin replacement therapy to manage their condition will be required by all people with type 1 diabetes, and some with type 2, gestational or other forms of diabetes.Lower-limb amputation
Diabetes is the leading cause of non-traumatic lower-limb amputation. In the lower limbs, high blood glucose levels can damage nerves (peripheral neuropathy) and result in poor circulation (peripheral vascular disease). This complication of diabetes can cause ischaemia (reduced blood supply to tissues), gangrene and impaired wound healing. It can lead to foot ulcers and infections and, in severe cases, amputations of the affected toes, foot and lower leg. In 2017–18, just under 6,000 lower-limb amputations were done for patients in hospital with a principal and/or additional diagnosis of diabetes. Lower-limb amputations were more common among males and those aged 65-and-over – 76% and 58%, respectively). This data provides a tally of in-hospital episodes for amputations, but does not determine the number of individuals undergoing amputation, the number of repeat amputations, nor establish the link between the amputation and diabetes.Notes & Sources
Note: the impact of diabetes on mortality is under-reported when examining only the underlying cause of death (Harding et al. 2014). Death certificates often omit diabetes as a cause of death (McEwen et al. 2011; Whittall 1990). Diabetes Overview - Australian Institute of Health and Welfare Australian Bureau of Statistics - National Health Survey: First results, 2017-18 financial year National Hospital Morbidity Database Australian Burden of Disease Study ABS 2011–12 Australian Health Survey
Originally published at
https://www.australiawidefirstaid.com.au/resources/diabetes-in-australia-statistics
as part of the Australia Wide First Aid Articles Library
Related Articles

Shark Attacks Australia 2022
Home to some of the world's most dangerous shark species, Australia is one of the deadliest countries when it comes to human/shark incidents. In this article, we explore the number and outcome of shark/human incidents that occurred in Australia in 2022, to date.

Leading Causes of Death in Australia 2021
Five diseases accounted for more than one-third of all deaths registered in Australia in 2021. And though our overall mortality rate remains low, Dementia is narrowing the gap to become one of Australia's deadliest diseases.
Leading Causes of Death in Australia: 2019 vs 2020
Health statistics are an invaluable tool for measuring the health of Australians and targeting prevention and treatment resources accordingly. In this article, we compare Australia's mortality rating from 2019 to 2020.
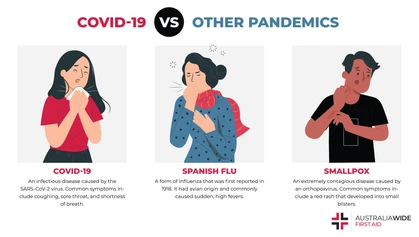
Comparing COVID-10 to Other Pandemics
COVID-19 is one of the first pandemics to drastically impact modern society. However, it is not the first pandemic in human history. Civilisations in times past have been plagued with Smallpox and the Spanish Flu, which share many similarities with COVID-19.
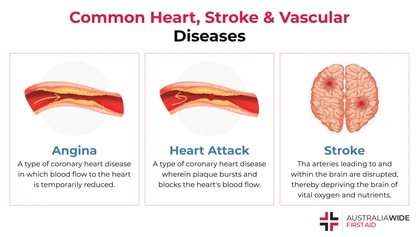
Heart, Stroke & Vascular Diseases Statistics
Heart, stroke, and vascular diseases (or cardiovascular disease) is an umbrella term for a wide variety of diseases that affect the heart and blood vessels. Statistics show that cardiovascular disease accounts for a significant number of hospitalisations and deaths in Australia.

Alcoholism in Australia
Alcoholism, which is more formally known as alcohol use disorder (AUD), is a medical condition in which a person cannot control their consumption of alcohol. AUD is a major health concern in Australia, as alcohol is pervasive in Australian culture.
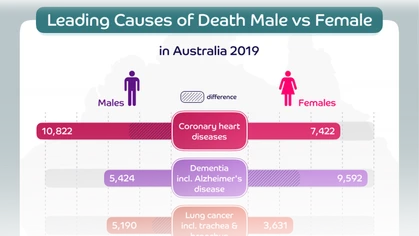
Causes of Death in Australian Men and Women
In 2019 there were 88,346 male deaths and 80,955 female deaths in Australia. What are the leading causes of death among them?

Respiratory Disease Statistics
Respiratory conditions affect the lungs and airways. These diseases can be chronic (long lasting) or acute (short term), causing ill health and disability, and also death.
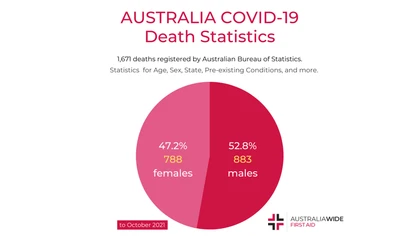
COVID-19 Deaths - Australia Statistics
COVID-19 deaths in Australia, to 31 October 2021, totalled 1,671. This includes 16 suspected as being due to COVID but not confirmed in a laboratory. Pre-existing chronic conditions were recorded on the death certificates of 71.2% of those who died, the most common condition being chronic heart diseases.
Leading Causes of Death in Australia 2019
Five diseases caused more than one-third of all deaths (35.6%) in Australia in 2019. But the way Australians are living and dying is changing. Coronary heart disease, which in 1968, was responsible for almost a third of all deaths, has been declining since.